
Analysis of Driver Behavior in Times of Crisis
Telematics data provides an abundance of information about large populations of drivers. This data can be used to analyze their collective behaviors and draw meaningful insights. This can be particularly useful for studying the behavior of drivers during a natural disaster. In this paper, we use telematics data to study the behavior of drivers impacted by Hurricanes Harvey and Irma.
We find that there is a clear change in the pattern of behavior during a hurricane. Our analysis shows both a decrease in the number of trips taken and the number of drivers on the road during a hurricane. As well, we see a reduction in the amount of over-speeding and shifts in the types of vehicles used as well as the road types used. This analysis will enable governments to better allocate disaster relief resources as well as help to implement policies to lower mortality rates and injury in the event of a disaster.
INTRODUCTION
Modern society depends on transportation systems as an integral part of its daily activities. Transportation systems cannot be considered as merely a group of independent distributed vehicles; rather, these vehicles constitute a collaborative network of vehicles that work together to share the road in an efficient manner, as shown in Figure 1.

Fig. 1. Example of a high-density road in an urban area with roadside infrastructure and on-board vehicle sensors.
Such networks, powered by today’s sensor-rich vehicles, allow for an intelligent and distributed sensing environment. The density of vehicles, as well as the spread of the transportation system enables the analysis of large populations of drivers to formulate deep insights about collective behaviors. These insights can be useful in analyzing the use of the transportation network, its social and economic impact, as well as deriving situation-aware knowledge. In particular, we can use this information to study behavior in times of crisis.
Hurricanes provide a natural case study for examining the collective behavior of drivers during a crisis. This is largely a result of their predictability, duration and often prolonged recovery or rebuilding period. On average, two hurricanes make landfall in the United States (US) per year according to the National Hurricane Center [1]. The US Government provides support for these types of disasters, and this support is funded by the Disaster Relief Fund (DRF). Hurricanes have been the biggest drain on this fund; emergency spending bills that surpass the DRF have been triggered 11 times in the past 16 years due to hurricanes in the US [2]. In 2017, the damages from hurricanes Harvey and Irma were estimated at $150-200 billion [3]. Damages to licensed vehicles were estimated between $2.9 to $4.7 billion for Hurricane Harvey alone [4], which is almost half the amount the Federal Emergency Management Agency (FEMA) budgeted for the 2017 DRF fund [5].
The excessive damage caused by hurricanes, particularly to vehicles, highlights the need to study the behavior of drivers during such natural disasters. Not only is there the monetary cost tied to damaged vehicles but there is also the increased cost to human life. The authors in [6] note that in developed countries, being in a motor vehicle during a flooding event increases the mortality risk. According to their research, 74% of all mortalities during a flooding event happened in a motor vehicle. This coincides with the findings in [7], who also find an increased mortality risk from being in a motor vehicle during a flood. In times of crisis, when flooding is imminent, the US government has adopted the slogan, “Turn Around, Don’t Drown®” due to the regularity of these tragedies [8]. They urge the public not to drive near roads with water flowing over the pavement during a hurricane. Studying driver behavior during these types of events can provide insights into how effective these public policy campaigns are.
In order to detect driver behavior, we rely on the existing sensors in modern vehicles. Modern vehicles are equipped with a set of sensors that can infer information about the vehicle’s state and the state of its surrounding environment. Additionally, some sensors are equipped with radio interfaces to communicate with the road infrastructure and other nodes. Furthermore, a telematics device (one example of such a device is shown in Figure 2(b) can be connected to the diagnostic connector in a vehicle. The diagnostic connector
offers on-board diagnostics, based on the On-Board Diagnostics (OBD-II) standard, with access to vehicle’s self-diagnostic and reporting capabilities [9]. As these devices become more ubiquitous, such sensory data and vehicle information can be used to study driver behavior.
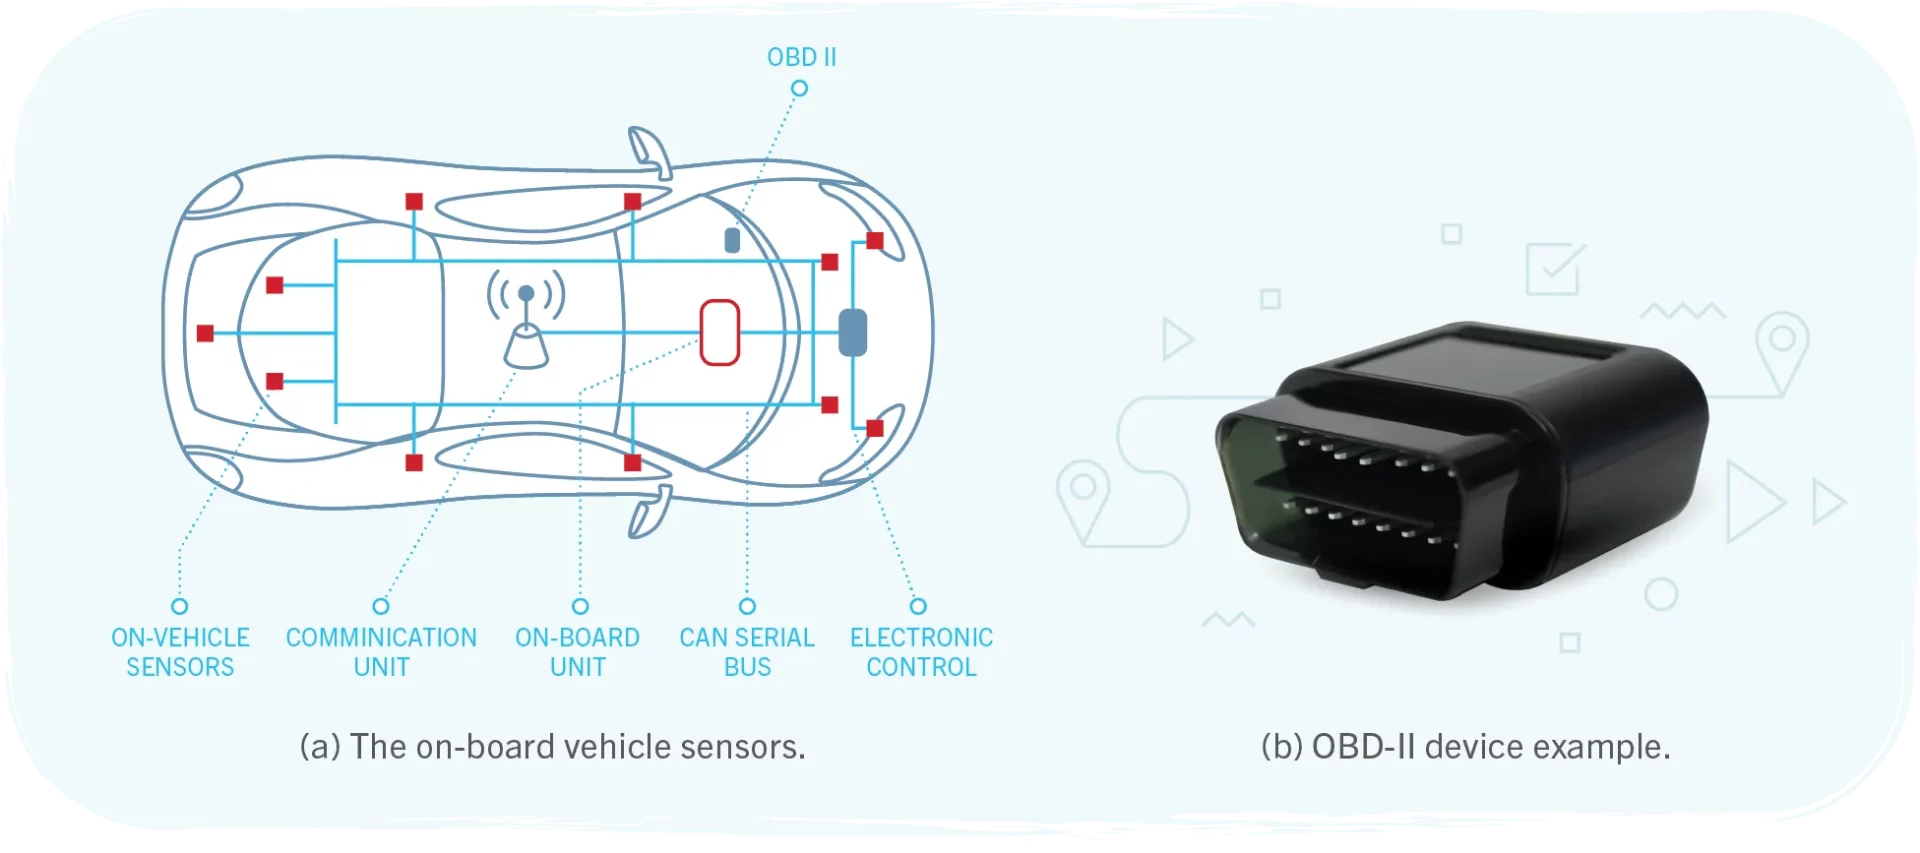
Fig. 2. A high-level representation of the on-board vehicle sensors and major diagnostic control and communication units in vehicles.
Previous work, [10] [11] [12] [13], has attempted to profile drivers individually based on the data retrieved by these sensors. Some have looked at the consequences of driving in unfavorable conditions [7] [6] and simulations have been created to estimate the outcome of evacuation orders [14] [15]. However, none of this work has used telematics data collected during a natural disaster to study the aggregate behavior of drivers. We propose using driver data collected during Hurricanes Harvey and Irma to better understand aggregate driver behavior in times of crisis. This will enable federal and state governments to allocate resources accordingly before a disaster or crisis, and also to implement life-saving policies to reduce mortality and injury in case of a disaster.
The remainder of this paper is organized as follows. In Section II, the dataset and sensors used are presented and described. In Section III, a discussion of the driving behavior in each hurricane is presented. Section IV presents conclusions based on this work.
II. DATASET DESCRIPTION
The telematics data is collected from drivers in the areas affected by one of the two hurricanes; Hurricane Harvey or Hurricane Irma. Hurricane Harvey significantly affected the southern part of Texas with the largest impact in the city of Houston. Thus, the drivers included in this study of Hurricane Harvey are those who took trips either starting or ending within 40 kilometers of the city center. On the other hand, Hurricane Irma impacted most of the state of Florida; thus, we focus on all drivers with trips either starting or ending in Florida to study the impact of Hurricane Irma.
To study the behavior of drivers during a natural disaster, we need to consider not just their behavior during the natural disaster but also their behavior before and after the disaster. As such, for Hurricane Harvey, we consider trips during the period of August 18 to September 1. For Hurricane Irma, we consider trips from August 28 to September 15. All the trip data was collected from vehicles with an OBD device and for this dataset, the OBD device reported location, speed, and accelerometer data from the vehicle.
III. ANALYSIS OF DRIVING BEHAVIOR
Hurricane Harvey began as a tropical wave off the west coast of Africa on August 13. By August 23 Harvey was declared a tropical depression and a state of disaster was declared for 30 Texas counties. By noon on August 24, it was predicted that Tropical Depression Harvey would grow into at least a Category Three hurricane, and a large number of Texas counties near the coast received mandatory evacuation orders with many other counties being urged to evacuate voluntarily [16]. Houston was not given any evacuation orders, mandatory or voluntary, due to the short notice of the hurricane and the large population. Instead, it was emphasized that the 6.5 million residents of Houston and surrounding areas should not evacuate, as this could lead to grid-locked roads, a catastrophic situation if flooding were to occur [17]. Although there was no evacuation order for Houston, Figure 4(a) shows a 38% increase in the number of trips taken on August 24 when compared to the six preceding days. However, Figure 5(a) shows that the average trip distance (blue) and duration (red) on August 24 were lower than the previous days’ values which suggests that people were most likely stocking up on supplies. Note that in Figures 3, 4, 5, 6, and 7, different periods related to the hurricanes are highlighted. The pink highlighted area represents the period in which the population knew of the hurricane and was asked to evacuate, i.e. Irma, or stay put in their homes, i.e. Harvey. The blue area represents the occurrence of the hurricane and its immediate effects on the area of interest.

Fig. 4. Percent of trips taken per day.

Fig. 5. Average trip distance and duration.
Before Hurricane Harvey, the data shows increased driver activity. However, during the hurricane, Figure 4(a) shows a 70% decrease in the number of trips. Figure 5(a) similarly shows a decrease in the distance (blue) and duration (red) of drivers’ trips during this period. This coincides with the windspeed and rainfall amounts that occurred during the hurricane as seen in Figures 3(a) and 3(b), respectively. Hurricane Harvey brought one of the heaviest rainfalls ever recorded in the continental US, breaking a previous record from 1979 [18].
Download Managing Natural Disasters Using Data Analytics and Insights White Paper >
References:
[1] “U.S. Hurricane Strikes by Decade.” [Online]. Available: https://www.nhc.noaa.gov/pastdec.shtml
[2] L. Desjardins, “How the U.S. funds disaster recovery and what it means for Harvey relief,” Sep 2017. [Online]. Available: https://www.pbs.org/newshour/nation/u-s-funds-disaster-recoverymeans-harvey-relief
[3] “Moodys Analytics sees economic cost of Irma at $64-92 billion,” Sep 2017. [Online]. Available: https://www.reuters.com/article/briefmoodys-analytics-sees-economic-cos/brief-moodys-analytics-seeseconomic-cost-of-irma-at-64-92-billion-idUSF9N1L0029
[4] A. Davies, “Harvey Wrecks Up to a Million Cars in Car-Dependent Houston,” Sep 2017. [Online]. Available: https://www.wired.com/story/harvey-houston-cars-ruined/
[5] “Disaster Relief Fund: FY 2017 Funding Requirements,” pp. 7–8, Feb 2016.
[6] S. Doocy, A. Daniels, S. Murray, and T. D. Kirsch, “The Human Impact of Floods: a Historical Review of Events 1980-2009 and Systematic Literature Review,” PLoS Currents, 2013.
[7] S. T. Ashley and W. S. Ashley, “Flood Fatalities in the United States,” Journal of Applied Meteorology and Climatology, vol. 47, no. 3, pp. 805–818, 2008. [Online]. Available: https://doi.org/10.1175/2007JAMC1611.1
[8] N. F. S. Home and N. W. S. US Department of Commerce, NOAA, “NWS Flood Safety Home Page,” Jan 2001. [Online]. Available:http://www.nws.noaa.gov/os/water/tadd/
[9] “Comparing Mobile Apps, Hybrid Bluetooth and OBD-II: Data Collection Options,” Intelligent Mechatronics Systems, Tech. Rep., 2017.
[10] J. W. Joubert, D. D. Beer, and N. D. Koker, “Combining accelerometer data and contextual variables to evaluate the risk of driver behaviour,” Transportation Research Part F: Traffic Psychology and Behaviour, vol. 41, pp. 80–96, 2016.
[11] J. Ferreira, E. Carvalho, B. V. Ferreira, C. D. Souza, Y. Suhara, A. Pentland, and G. Pessin, “Driver behavior profiling: An investigation with different smartphone sensors and machine learning,” Plos One, vol. 12, no. 4, Oct 2017.
[12] W. Weidner, F. W. Transchel, and R. Weidner, “Telematic driving profile classification in car insurance pricing,” Annals of Actuarial Science, vol. 11, no. 02, pp. 213–236, 2016.
[13] D. Yokoyama and M. Toyoda, “Towards constructing a driver management system based on large-scale driving operation records,” 2017 IEEE International Conference on Big Data (Big Data),2017.
[14] X. Chen, J. W. Meaker, and F. B. Zhan, “Agent-Based Modeling and Analysis of Hurricane Evacuation Procedures for the Florida Keys,” Natural Hazards, vol. 38, no. 3, p. 321, Jul 2006. [Online]. Available: https://doi.org/10.1007/s11069-005-0263-0
[15] R. Robinson and A. Khattak, “Route Change Decision Making by Hurricane Evacuees Facing Congestion,” Transportation Research Record: Journal of the Transportation Research Board, vol. 2196, pp. 168–175, 2010.
[16] A. Foster, “Hurricane Harvey evacuation map: Where are evacuation zones in Texas, USA?” Aug 2017. [Online]. Available: https://www.express.co.uk/news/weather/845875/Hurricane-Harveyevacuation-map-list-where-evacuations-Texas-zone-maps-USA-Houston[17] D. Andone, “Why didn’t Houston evacuate?” Aug 2017. [Online]. Available: https://www.cnn.com/2017/08/27/us/houstonevacuation-hurricane-harvey/index.html
[18] A. Chen, “Tropical storm Harvey has set a new record for rain in the continental U.S.” Aug 2017. [Online]. Available: https://www.theverge.com/2017/8/29/16223338/hurricane-harveystorm-
record-rainfall-flooding-texas
[19] L. J. Huriash, “Florida death toll from Hurricane Irma keeps rising,” Nov 2017. [Online]. Available: http://www.sun-sentinel.com/news/weather/hurricane/fl-reghurricane-irma-deaths-20171120-story.html
[20] “Hurricane Irma evacuation zones in Florida, other states.” [Online]. Available: http://time.com/4931378/hurricane-irma-evacuation-zones/
[21] R. Ellis, “Florida Gov. Rick Scott tells residents: ‘You need to go right now’,” Sep 2017. [Online]. Available: https://www.cnn.com/2017/09/08/us/hurricane-irma-evacuationflorida/index.html
[22] C. E. Shoichet, H. Yan, and F. Karimi, “Irma climbs Florida’s coast; ’dangerous’ storm surges feared,” Sep 2017. [Online].
Available: https://www.cnn.com/2017/09/10/us/hurricane-irma-floridaimpact/index.html
[23] E. Hobson, “Hurricane Harvey: Texas residents use their trucks to help free trapped firetruck,” Sep 2017. [Online].
Available: https://globalnews.ca/news/3714741/hurricane
[24] M. S. F. Dailymail.com, “Pickup turned submarine! Rescuers drive through eight-foot-deep floodwaters in Texas town to help victims of Hurricane Harvey,” Sep 2017. [Online]. Available: http://www.dailymail.co.uk/news/article-4884292/Pickup-drives- 8ft-floodwaters-Hurricane-Harvey.html
[25] “Pickup Truck Interest Rises in the Aftermath of Hurricanes.” [Online]. Available: http://www.autorentalnews.com/
channel/remarketing/news/story/2017/09/pickuptruck- interest-rises-in-the-aftermath-of-hurricanes.aspx